
Cloud Monitoring and Observability

Outdoorsman | Networking | SRE | Chaos & Platform Engineering | DevOps @toyotaracing | former @aws @splunk @verizon @gm | Thoughts are my own
Personal: Husband | GirldadX3 | BBQ | Outdoors | Nascar | Baseball | Triathlons
In the early days of my career, I had the privilege of working with an innovative monitoring system called RAVS (Reality and Asset Verification Service). RAVS, a product of Alcatel-Lucent, was created to provide a real-time look into system assets and ensure their functionality and reliability. I was captivated by its capabilities, and it was this experience with RAVS that sparked my enduring passion for monitoring.
Fueled by this newfound passion, I decided to take my monitoring skills to the next level. I created a mobile app for Verizon executives that provided real-time insights into call statistics on the VoLTE (Voice over LTE) network we were building. It was a project that blended my love for monitoring with my drive to innovate and make an impact. I used repurposed hardware as this was pre-cloud, and that was a big win in their eyes as I did not have to ask for money! WIN WIN
Monitoring systems, like RAVS, have the power to influence not only our careers but also the direction of the technology landscape. In a world that's constantly pushing technological boundaries, it's vital to ensure the systems we build are resilient and reliable. Monitoring is not simply about keeping an eye on system performance. It's about foreseeing potential issues and addressing them before they cause serious disruptions. Lets take that a step further and talk about observability. Observability is the ability to see inside a system and understand its inner workings. It's about having a holistic view of your system's performance, not just a narrow focus on isolated metrics. When you combine monitoring with observability, you gain deeper insights into your systems, allowing you to preemptively address issues before they escalate into major disruptions.
As we embark on this journey together, I'll be sharing my experiences, insights, and tips on monitoring and observability. Here's what you can expect to learn:
Logging and Error Tracking: A deep dive into the essential art of logging and error tracking, the foundation of any effective monitoring system.
Golden Signals of Monitoring: Unveiling the key indicators that should be on your radar for optimal performance and stability.
Observability - Logs, Metrics, Traces: A look at the three pillars of observability and how to use them for a complete view of your systems.
Synthetic Monitoring: Exploring what synthetic monitoring is and why it deserves a spot in your monitoring toolbox.
Eyes on Eyes/Monitor the Monitor: The importance of keeping an eye on your monitoring system to avoid blind spots.
Best Practices for Monitoring and Observability: A list of tried and true practices that have proven effective over time.
My Favorite Monitoring Tools and Techniques: A compilation of the best tools and techniques that have become my go-to's throughout my career.
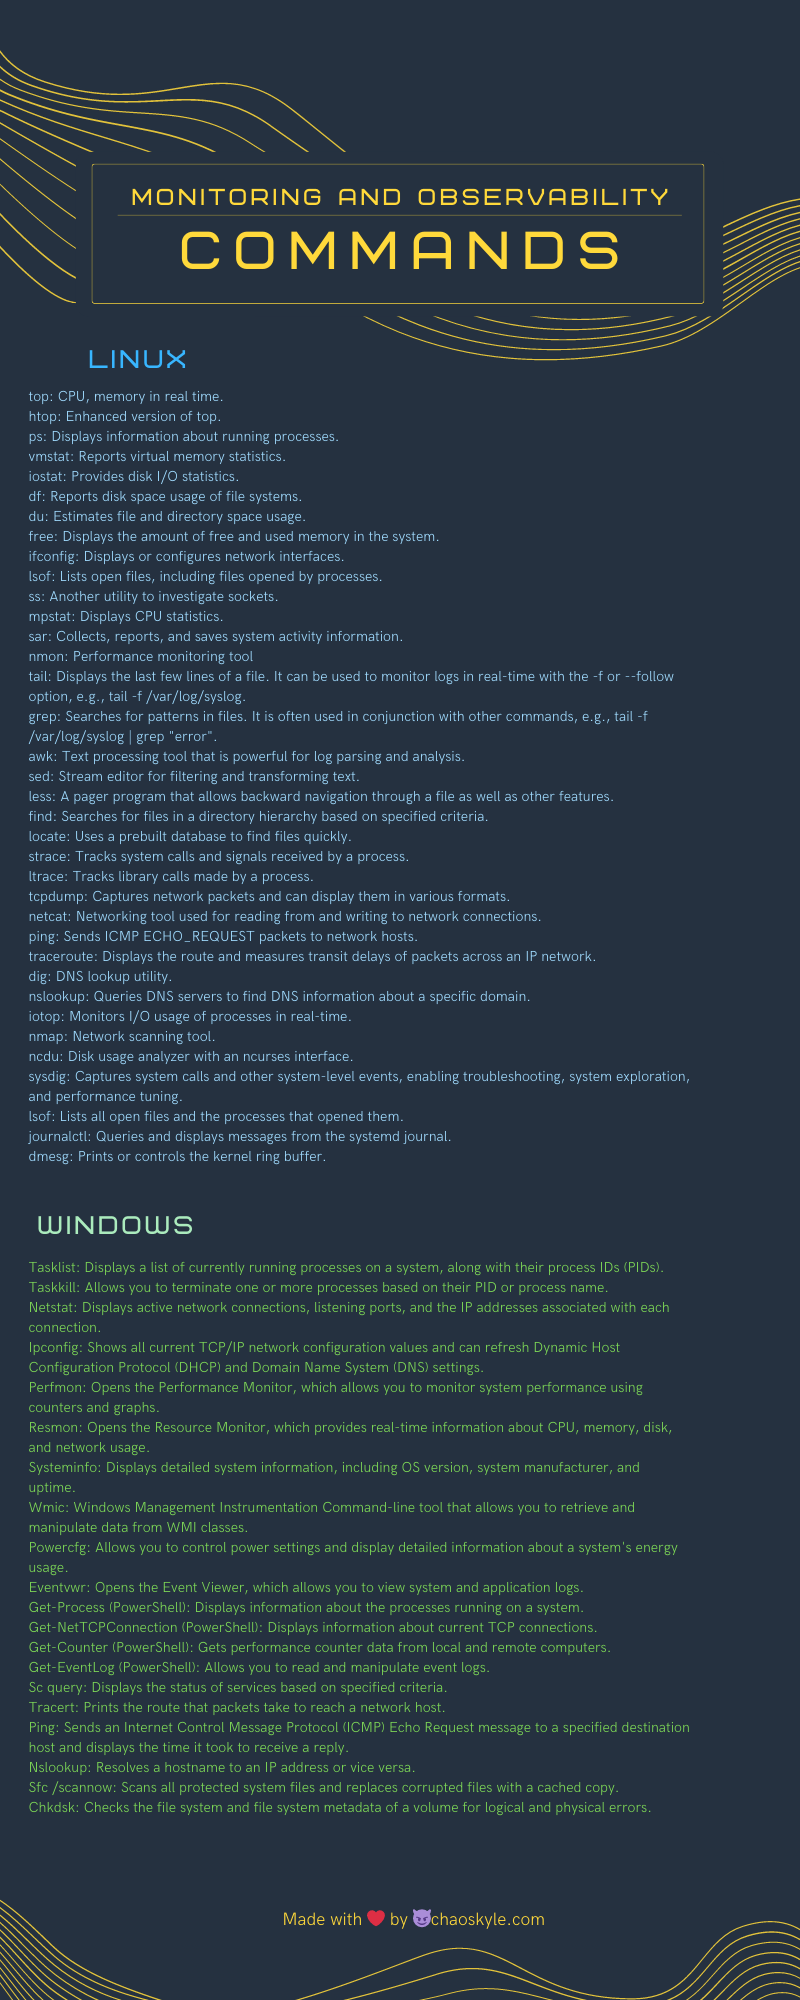
Linux and Windows Monitoring Commands Pictogram: A handy reference to the essential commands you need for monitoring on Linux and Windows systems.
Lets get poppin
Cloud Logging and Error Tracking
In the cloud era, logging and error tracking are more crucial than ever. With the complexity and scale of modern systems, these practices help maintain transparency, accountability, and performance. When it comes to cloud-based error tracking, common methods include centralized logging, log aggregation, and automated error-tracking services. These approaches can help you spot and address errors more efficiently across distributed systems.
When it comes to logging, several types of logs are typically used in cloud environments. These include:
Authentication (auth) Logs: These logs track who is accessing your system and when. They can provide valuable information in case of a security breach.
System (sys) Logs: These logs capture information about the system operations, including startups and shutdowns, hardware status, and system errors.
Application (app) Logs: These logs record events related to the applications running on the system. This can include error messages, information on the flow of operations, and performance data.
Initialization (init) Logs: These logs contain information about the initialization processes of various services on your system.
System (system) Logs: These logs track system-level events like hardware failures, kernel issues, and other operating system-related messages.
In most Linux-based systems, you can usually find these logs stored in the /var/log directory. This is the conventional location where system and application logs are stored. Here, you can access log files that can help diagnose issues, monitor system performance, and more. For example, you may find auth.log for authentication-related logs or syslog for system logs.
Logging and error tracking are crucial practices for any IT system, especially in the cloud where the sheer scale and complexity can make issues harder to pin down. By regularly monitoring these logs and effectively tracking errors, you can ensure smoother operations, better performance, and improved security. Keep in mind that logs can accumulate quickly, so it's crucial to manage and rotate them properly to avoid running out of disk space. Archiving and backup strategies are crucial to operational excellence.
Golden Signals of Monitoring
As engineers and system administrators, we often find ourselves facing a plethora of metrics and data when it comes to monitoring our systems. However, amidst this ocean of information, it's essential to focus on a few key signals that give us a high-level view of our system's health. These key signals are known as the "Golden Signals of Monitoring," a term popularized by Google's Site Reliability Engineering (SRE) team.
The Golden Signals are a set of four crucial metrics that provide a comprehensive understanding of the behavior and performance of a system. By monitoring these signals, you can quickly identify and diagnose issues that might impact the user experience or overall system health. Here are the four Golden Signals:
Latency: This metric measures the time it takes for a system to respond to a request. Latency can be measured at different points in the system, such as at the application level, network level, or database level. Monitoring latency helps you identify slow or unresponsive components, which can directly impact the user experience. For real time data applications this can be crucial and have serious implications if data ingest gets delayed due to latency. miliseconds can corrupt a dashboard so just because always stay vigilant with this signal for time series/sensitive workloads.
Traffic: Traffic, also known as "request rate" or "throughput," represents the volume of requests your system is receiving. Monitoring traffic helps you understand the load on your system and allows you to detect unusual patterns, such as spikes or drops in traffic, which can indicate potential problems or areas that need scaling. Throughout my career, traffic normally does two things when shit hits the fan: Drops or spikes. Obviously if users cant make requests then they will stop trying, but its good to have ddos protection for when traffic goes bizerko. Always always always have metrics on traffic as this is normally the first thing I go to look at. (Network engineers 4 lyfe)
Errors: Error rate is the percentage of requests that result in an error response. Monitoring error rates can help you quickly identify issues within your system that need attention. A sudden increase in error rates can indicate a system malfunction, a misconfiguration, or even a potential security threat. 4xx normall are client/auth errors 5xx are system/gateway errors. Try to correlate different metric patterns that align with errors/warnings. This is a very very very important skill to have as a devops/sre.
Saturation: Saturation refers to the capacity utilization of your system resources, such as CPU, memory, and network bandwidth. Monitoring saturation helps you understand how close your system is to reaching its maximum capacity. If the saturation level is too high, it might be time to scale your resources to prevent bottlenecks or system failures. Saturation to me is how many people are riding in the boat. If you have too many then the boat cant go no where.
The Golden Signals of Monitoring offer a concise yet comprehensive view of your system's health. By keeping an eye on these four signals - Latency, Traffic, Errors, and Saturation - you can quickly identify and diagnose issues, optimize performance, and ensure a seamless user experience.
These signals serve as a solid foundation for building more sophisticated monitoring strategies and tools, which we will explore further in the next chapter on Observability.
Observability
Observability is an essential concept in system monitoring and goes beyond simply keeping an eye on predefined metrics. It's about gaining a deeper, more holistic understanding of your system's internal state from the data it generates, especially in complex, distributed environments. Observability allows you to ask questions about your system's behavior and performance that you might not have initially considered.
To achieve a high level of observability in your systems, you can rely on the "three pillars of observability": logs, metrics, and traces. These three elements, when used together, provide a comprehensive view of your system's behavior.
Logs: Logs are a record of events that have occurred within a system, and they provide a granular view of system activity. They can be helpful for debugging issues, understanding usage patterns, and identifying anomalies. Tools that collect and manage logs are often categorized under Security Information and Event Management (SIEM) systems. These tools, such as Splunk, ELK Stack, or Sumo Logic, can help you analyze and visualize logs in real-time, making it easier to identify trends and patterns.
Metrics: Metrics are numerical measurements that represent specific data points in your system over time. Metrics can range from the number of active users to the average response time of your application. They allow you to quantify and visualize the performance and health of your system. One of the popular tools for collecting and analyzing metrics is Prometheus. It can scrape and store metrics, and it integrates with Grafana for visualization. Other tools, such as Zabbix and Nagios, also offer comprehensive metric collection and monitoring capabilities.
Traces: Tracing captures the journey of a request as it flows through various components of a distributed system. Traces provide context and help you understand the interactions between different services, especially in microservices-based architectures. Application Performance Management (APM) tools like New Relic, Datadog, or Dynatrace can help you with tracing, allowing you to visualize the flow of requests through your system, measure the latency of each step, and identify bottlenecks.
By collecting and analyzing data from logs, metrics, and traces, you can create a comprehensive picture of your system, diagnose complex issues, and even predict and mitigate future problems. Observability is not just about identifying and fixing problems; it's about understanding why they happen and how they can be prevented.
To implement observability effectively, you'll need the right tools. As mentioned, various platforms like Honeycomb, Grafana, Prometheus, Jaeger, and OpenTelemetry offer powerful features for collecting, analyzing, and visualizing data from your systems. Later in this article, we'll dive deeper into some of my favorite tools, discussing their unique features, best practices for implementation, and how to maximize the value of your observability efforts.
As we continue this journey, we'll delve deeper into advanced monitoring and observability practices, explore more tools and best practices, and learn how to monitor the monitor, ensuring that your systems remain healthy and resilient.
Advanced/Synthetic Monitoring
In the world of monitoring, it's not enough to merely observe the internal workings of a system. You must also be able to understand how your system performs under various scenarios and anticipate potential issues before they occur. This is where advanced and synthetic monitoring comes into play.
Advanced monitoring techniques go beyond basic metrics, logs, and traces, incorporating a range of methodologies to provide deeper insights into system behavior. Synthetic monitoring, a subset of advanced monitoring, simulates user interactions with a system to measure performance and availability from the end user's perspective.
Synthetic monitoring involves creating and executing scripted tests that mimic real user interactions with your application. By simulating different scenarios, you can measure the performance of your application under various conditions, identify bottlenecks, and diagnose potential issues before they impact your users.
But before diving into synthetic monitoring, it's crucial to have a solid foundation in basic monitoring techniques. Properly monitoring your system's logs, metrics, and traces is a prerequisite for synthetic monitoring. Without this foundation, your synthetic tests may lack context and accuracy.
Implementing Synthetic Monitoring
Understand Your Users: Before creating synthetic tests, it's crucial to understand your users' behavior. Analyze your application's usage patterns, identify common user journeys, and prioritize the most critical user interactions for testing.
Script User Journeys: Develop scripts that simulate real user interactions with your application. These scripts should replicate actions like clicking buttons, filling out forms, and navigating through your application.
Run Tests Periodically: Execute your synthetic tests at regular intervals to continuously monitor your application's performance and availability. Schedule tests during peak and off-peak hours to understand how your application performs under different traffic conditions.
Analyze Results: Collect and analyze the results of your synthetic tests. Identify performance bottlenecks, slow-loading pages, and errors. Use these insights to optimize your application and improve the user experience.
Monitor the Basics: Remember that synthetic monitoring is not a replacement for traditional monitoring techniques. Continuously monitor your system's logs, metrics, and traces to provide context and depth to your synthetic test results.
Advanced Monitoring Techniques
In addition to synthetic monitoring, advanced monitoring encompasses a range of techniques to gain deeper insights into your system's behavior. Some of these techniques include anomaly detection, root cause analysis, and predictive monitoring via AI/MLops. Ive also been using chaos engineering which relies heavily on monitoring to validate my hypothesis.
Synthetic and advanced monitoring play a crucial role in ensuring the resilience and reliability of modern systems. By simulating user interactions, detecting anomalies, and analyzing root causes, you can optimize your application's performance, anticipate potential issues, and provide a seamless user experience.
Monitoring Best Practices
Effective monitoring practices are crucial for ensuring the reliability and performance of your systems. In this chapter, we'll explore some best practices for implementing a robust and scalable monitoring strategy. These practices will help you gain valuable insights into your system's behavior, identify and resolve issues quickly, and optimize performance.
Keep Monitoring Separate from Production: Monitoring systems should be isolated from your production environment to avoid interference with your applications' performance. Run your monitoring infrastructure on separate servers or containers to ensure that monitoring activities don't impact production workloads.
Monitor the Basics: Focus on the essential metrics, logs, and traces that provide the most valuable insights into your system's behavior. Avoid the temptation to monitor everything, as it can lead to information overload and make it harder to identify and prioritize critical issues.
Use Lightweight Agents: Choose monitoring agents that have minimal impact on system performance. Ensure that the overhead from monitoring agents doesn't affect your applications' response times or resource usage.
Set Meaningful Alerts: Create alerts that notify you of potential issues before they escalate into major problems. Set meaningful thresholds based on historical data and business requirements, and avoid setting too many alerts that can lead to alert fatigue.
Document Monitoring Practices: Document your monitoring practices, including the tools you use, the metrics you track, and the thresholds for alerts. Share this documentation with your team to ensure a consistent approach to monitoring.
Test Your Monitoring: Periodically test your monitoring infrastructure to ensure that it's working correctly. Simulate failures or performance issues and verify that your monitoring system detects them and sends alerts as expected.
Monitor Your Monitoring: Keep an eye on the health and performance of your monitoring infrastructure. Track the availability, response times, and resource usage of your monitoring tools to ensure that they can provide accurate insights when needed. Keep 👀 on the 👀
Perform Root Cause Analysis: When an issue occurs, don't just fix the symptoms. Investigate the root cause of the problem and address it to prevent similar issues in the future. Use logs, metrics, traces, and other data sources to diagnose and understand the underlying cause of the issue.
Review and Update Your Monitoring Strategy: Regularly review your monitoring practices and update them as your system evolves. As your applications grow and change, your monitoring needs may also change. Continuously evaluate your monitoring strategy to ensure it remains effective and aligned with your business requirements.
Balance Proactive and Reactive Monitoring: While it's essential to react quickly to issues, proactive monitoring can help you identify and address potential problems before they occur. Use predictive monitoring and anomaly detection techniques to anticipate and mitigate future issues.
Educate Your Team: Ensure that your team is familiar with your monitoring practices, tools, and processes. Provide training and resources to help them use monitoring effectively and respond to issues promptly.
Automate the deployment of monitoring agents/operators: Leverage tools like terraform to automate the deployment of your monitoring infra. Don’t make developers do the dirty work, they cant handle that much responsibility lol.
By following these best practices, you can build a robust and scalable monitoring strategy that helps you gain valuable insights, identify and resolve issues quickly, and optimize your systems' performance.
Absolutely! Here is the "My Favorite Tools" section, where I will mention and briefly describe some popular monitoring and observability tools, and include the links to their official websites:
My Favorite Tools
Over the years, I've had the chance to use a variety of monitoring and observability tools. Here are some of my favorites, including both open-source and cloud provider offerings:
Grafana: Grafana is an open-source platform for monitoring and observability, known for its flexible visualization options. It integrates with many data sources, including Loki and Prometheus. Visit Grafana
Nagios: Nagios is a well-established open-source monitoring system that offers monitoring and alerting services for servers, network devices, applications, and services. Visit Nagios
Loki: Loki is a horizontally-scalable, highly-available, multi-tenant log aggregation system inspired by Prometheus. It's designed to be cost-effective and easy to operate. Visit Loki
AWS CloudWatch: CloudWatch is a monitoring and observability service from AWS that provides data and actionable insights to monitor applications, respond to system-wide performance changes, and optimize resource utilization. Visit CloudWatch
Google Stackdriver: Stackdriver, now called Google Cloud Operations suite, is a hybrid monitoring, logging, and diagnostics tool suite for applications on Google Cloud and AWS. It integrates with popular open-source monitoring tools. Visit Google Cloud Operations
Azure Monitor: Azure Monitor collects, analyzes, and acts on telemetry data from your Azure and on-premises environments. It helps you maximize performance and availability and proactively identify problems. Visit Azure Monitor
Each of these tools has unique features that make it suitable for specific use cases. It's crucial to select the tools that best fit your needs and work seamlessly with your existing infrastructure. There are others on the market but these are the ones that I have the most experience with. *These are not affiliate paid endorsements
In the fast-paced world of technology, monitoring and observability play a pivotal role in ensuring the performance, stability, and security of complex systems. As I've explored throughout this article, my journey into the realm of monitoring began with RAVs, the Reality and Asset Verification Service from Alcatel-Lucent. It was an essential tool during the VoLTE deployment phase with Verizon, providing real-time insights into network call stats. Since then, I've come to appreciate the immense value that monitoring and observability bring to resilient systems.
We've delved deep into the most fundamental aspects of monitoring, including tools and techniques, logging and error tracking, and the golden signals of monitoring. We examined the intricacies of observability and discussed how logs, metrics, and traces all play a part in achieving a comprehensive view of system performance. We also explored the realm of synthetic monitoring and shared some best practices to keep in mind when implementing monitoring solutions.
A crucial lesson I've learned through my experiences is that effective monitoring is an ongoing process that requires continuous improvement and adaptation. It's essential to monitor the basics, but it's equally important to move beyond traditional monitoring techniques and embrace observability and synthetic monitoring. By doing so, we can gain deeper insights into our systems and detect anomalies and issues before they escalate into significant problems.